A flutter package which makes it easier to plot different types of charts with lots of customization, made purely in dart

Overview

Build Status pub package

multi_charts

It is a library that provides different types of charts to plot data points. Currently it supports only Radar Chart, but will support more types in the coming future.
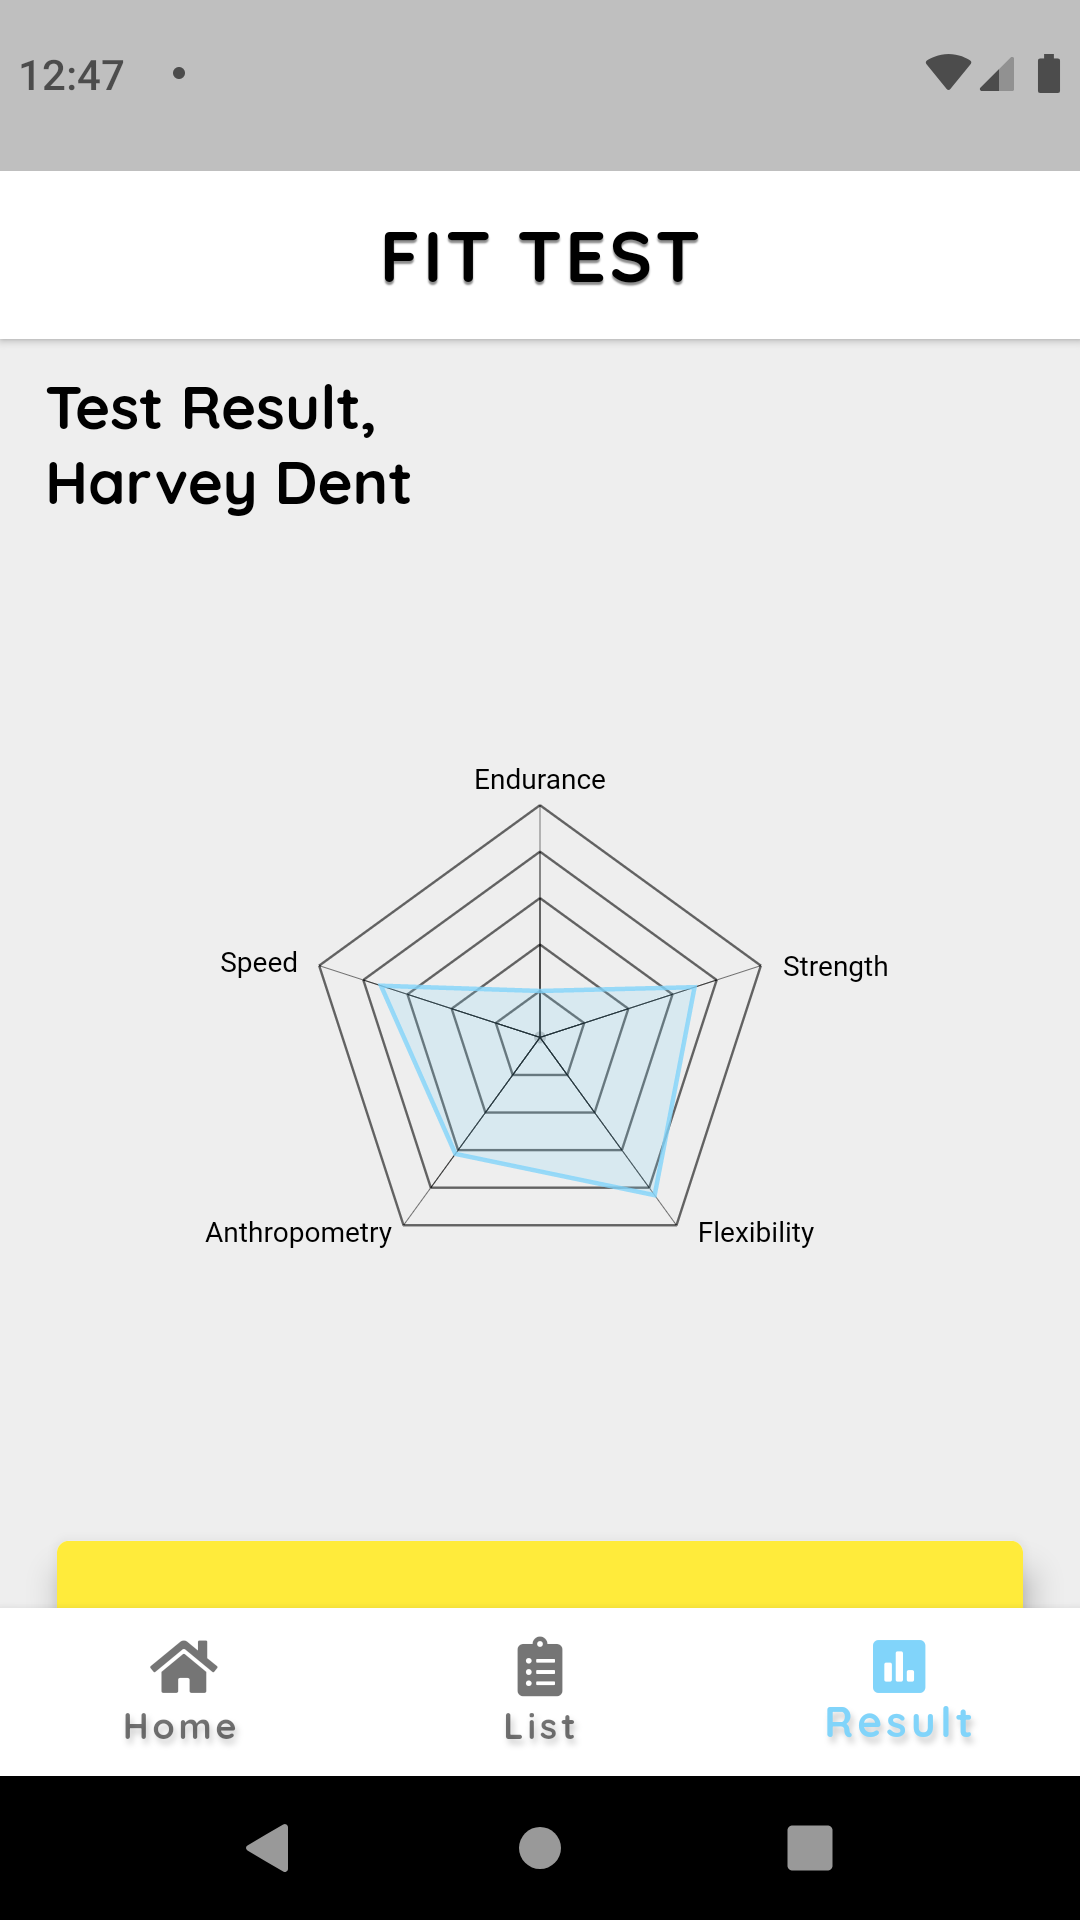
Radar Chart

A chart which plots the values in the form of a spider web or radar. It takes the @required values parameter which provides the data points (minimum 3 values are required) and @required maxValue which defines the scale of the graph. E.g. The chart contains five levels, if maxValue=10, then each level will have the value 2.

The other parameters are optional which define different behaviours for the chart like:

  • labels - which will be shown in the graph, if not provided, will default to the value of data points. If provided, it's length should be same as that of values

  • size - which defines the canvas area defaults to Size.infinite and is constrained by the parent widget.

  • fillColor - defines the background color of the plotted graph, if not provided, defaults to Colors.black26.

  • strokeColor - defines the color of the chart outlines, defaults to Colors.black87.

  • labelColor - defines the color of the chart labels, defaults to Colors.black.

  • maxHeight and maxWidth - defines the maximum width and height of the chart when no parent constraints are applied, otherwise ignored.

  • textScaleFactor - defines the factor by which the label's textSize should increase, if not provided defaults to 0.04

  • labelWidth - defines the maximum width of the labels, if not provided, defaults to internally calculated values based on the size of the chart.

  • maxLinesForLabels - defines the maximum lines for the label's text, if not provided, defaults to the hundredth part of the container height of the parent container. E.g.if height of the parent is 200, the maxLinesForLabels = 2

  • animate - defines the animation toggle, if true, the chart will animate, else not. Defaults to true.

  • animationDuration - defines the duration (in milliseconds) of the animation for the graph. If not provided, defaults to 1500 milliseconds.

  • curve - defines the animation's progress in a non-linear fashion.

  • chartRadiusFactor - defines the factor by which the chart radius increases with respect to width or height (whatever is minimum). If not provided, defaults to 0.8 (80%).

Screenshots

Radar Chart Red

Radar Chart Blue

Pie Chart

A chart type which plots the values in the form of a pie with different slices representing different values. It takes the @required values parameter which provides the data data to plot the graph.

The other parameters are optional which define different behaviors for the chart like:

  • labels - which will be shown in the graph, if not provided, will default to the value of data points. If provided, it's length should be same as that of values

  • size which defines the canvas area defaults to Size.infinite and is constrained by the parent widget.

  • sliceFillColors defines the background color of each slice of the graph, if not provided, random colors will be generated.

  • maxHeight and maxWidth defines the maximum width and height of the chart when no parent constraints are applied, otherwise ignored.

  • labelColor defines the color of the chart values, defaults to Colors.black87.

  • legendTextColor defines the color of the chart legend text, defaults to Colors.black.

  • legendPosition defines the position of the chart legend in the layout. It can either be

LegendPosition.Left, LegendPosition.Top, LegendPosition.Right or LegendPosition.Bottom. The default position is LegendPosition.Right.

  • legendIconSize defines the size of the legend icons. The default size value is 10.0.

  • legendTextSize defines the the text size of the legend labels. The default text size is 16.0.

  • legendItemPadding defines the padding around and in between the legend row items. The default padding is 8.0.

  • legendIconShape defines the shape of the legend icons. It can either be LegendIconShape.Circle or LegendIconShape.Square. The default shape is LegendIconShape.Square.

  • textScaleFactor defines the factor by which the label's textSize increases with respect to the average of width and height of the enclosing parent widget, if not provided defaults to 0.04.

  • animate defines the animation toggle, if true, the chart will animate, else not. Defaults to true.

  • animationDuration defines the duration (in milliseconds) of the animation for the graph. If not provided, defaults to 1500 milliseconds.

  • curve defines the animation's progress in a non-linear fashion.

  • separateFocusedValue defines whether we want to highlight focused value (of type: SeparatedValue.Max or SeparatedValue.Min) as a slice separated from the chart. By default, it is set to false.

  • separatedValueType defines which value slice to show as separated. It can be either SeparatedValue.Max or SeparatedValue.Min. The default value is SeparatedValue.Max.

  • startAngle defines the start angle (in degrees) of the chart's radial position. The default value is 180.

  • showLegend defines whether to show the chart legend or not. By default, it is set to true.

Screenshots

Radar Chart Red

Radar Chart Blue

You might also like...

In this project you will see how to generate charts with the data from the Firestore.

In this project you will see how to generate charts with the data from the Firestore.

FlutterChartFirestore Flutter Tutorial - Flutter Charts+Firestore Video series can be watched here https://youtu.be/HGkbPrTSndM Getting Started In thi

Oct 21, 2022

A powerful 🚀 Android chart view / graph view library, supporting line- bar- pie- radar- bubble- and candlestick charts as well as scaling, panning and animations.

A powerful 🚀 Android chart view / graph view library, supporting line- bar- pie- radar- bubble- and candlestick charts as well as scaling, panning and animations.

⚡ A powerful & easy to use chart library for Android ⚡ Charts is the iOS version of this library Table of Contents Quick Start Gradle Maven Documentat

Dec 28, 2022

kg_charts icon library. At present, there are only radar charts

kg_charts icon library. At present, there are only radar charts

kg_charts icon library. At present, there are only radar charts. Other types of charts may be added later

Oct 25, 2022

Portfolio made using Flutter

Portfolio made using Flutter

My Portfolio: Ayush P Gupta This repo is the source code of my portfolio app. 📱 View Live Demo Learning App has some unique animations on each page.

Apr 20, 2022

A pretty plotting package for Flutter apps

A pretty plotting package for Flutter apps

flutter_plot R. C. Howell - 2018 A pretty plotting package for Flutter apps. Sizing and autopadding isn't great right now, but tinkering with padding

Sep 27, 2022

Animating Location Pin Flutter Package

Animating Location Pin Flutter Package

Animating Location Pin This Flutter package provides a Animating Location Pin Widget which can be used while fetching device location. 💻 Installation

Jun 15, 2021

Sliver bar chart - A package that supports Bar Chart in a Flutter Sliver

Sliver bar chart - A package that supports Bar Chart in a Flutter Sliver

Sliver bar chart - A package that supports Bar Chart in a Flutter Sliver. This Package allows us to add Bar Chart in Sliver and sets a Bar Chart as a Header on Slivers Scroll.

Oct 11, 2022

A powerful Flutter chart library, currently supporting Line Chart, Bar Chart, Pie Chart, Scatter Chart and Radar Chart.

A powerful Flutter chart library, currently supporting Line Chart, Bar Chart, Pie Chart, Scatter Chart and Radar Chart.

FL Chart 💥 A library to draw fantastic charts in Flutter 💥 Chart Types LineChart BarChart PieChart Read More Read More Read More ScatterChart RadarC

Dec 27, 2022

A beautiful bezier line chart widget for flutter that is highly interactive and configurable.

A beautiful bezier line chart widget for flutter that is highly interactive and configurable.

Bezier Chart A beautiful bezier line chart widget for flutter that is highly interactive and configurable. Features Multi bezier lines Allow numbers a

Dec 21, 2022
Comments
  • Remove empty space surrounding the chart

    Remove empty space surrounding the chart

    Is there anyway I can remove empty space that surrounding the chart?

    Here's the code :

    double _height = MediaQuery.of(context).size.height * 0.55;
    
    return RadarChart(
     maxHeight: _height,
     size: Size.infinite,
     maxValue: 5.0,
     values: _values,
     labels: _labels,
     fillColor: Colors.lightBlue[200],
     textScaleFactor: .03,
    );
    

    Already set the Size into .fromHeight and .fromWidth but still there's empty space surrounding it. Any ideas?

    enhancement 
    opened by erpriliano 3
  • Radar chart's labels don't show on desktop

    Radar chart's labels don't show on desktop

    Everything works well using the radar chart in a desktop app except the labels that do not show. No text is visible. It works on mobile fine with the same code.

    For info I compiled the desktop app using Go Flutter

    opened by synw 5
Owner
Intkhab Ahmed
Freelance Web and Android Developer having big passion for Tech. Working at Gojek Tech as an Android Developer.
Intkhab Ahmed
Flutter package for creating simple yet modern looking charts

A package for creating simple yet modern looking charts. Five chart types Bar Gauge Line Pie Radar Canvas + DOM modern_charts combines Canvas and DOM

Man Hoang 68 Nov 4, 2022
Charts Library for Flutter, written in Dart with Flutter.

Table of Contents New in the current release Illustration of the new "iterative auto layout" feature Autolayout step 1 Autolayout step 2 Autolayout st

Milan Zimmermann 225 Dec 25, 2022
Animated radial and pie charts for Flutter

Flutter Circular Chart A library for creating animated circular chart widgets with Flutter, inspired by Zero to One with Flutter. Overview Create easi

Victor Choueiri 387 Dec 26, 2022
Beautiful sparkline charts for Flutter

flutter_sparkline Beautiful sparkline charts for Flutter. Installation Install the latest version from pub. Quick Start Import the package, create a S

Victor Choueiri 255 Dec 21, 2022
Elegant OHLC Candlestick and Trade Volume charts for @Flutter

flutter_candlesticks Elegant OHLC Candlestick and Trade Volume charts for Flutter Usage Install for Flutter with pub. Property Description data Requir

Trent Piercy 402 Dec 21, 2022
A library to draw fantastic bar charts race in Flutter

bar_chart_race The first library to draw fantastic bar charts race in Flutter Usage Let's get started add the dependencies to your app: dependencies:

Mimene Younes 6 Jun 24, 2022
Flutter chart library contains depth charts supporting various indicators and zooming

flutter_k_chart 介绍 一个仿火币的flutter图表库包含深度图,支持各种指标及放大缩小、平移等操作 webdemo演示 Demo v0.1.0:下载 APK 演示 简单用例 1.在 pubspec.yaml 中添加依赖 本项目数据来自火币openApi,火币的接口可能需要翻墙,接口

gwh 259 Dec 30, 2022
Flutter Cryptocurrency Charts application based on Clean Architecture.

About the project The purpose of this project is to develop the best Cryptocurrency, markets data and charts experience. This project has been built u

null 25 Jan 1, 2023
Charts [2148⭐] - By Google Team.

Charts is a general charting library, currently enabled for the Flutter mobile UI framework. See the online gallery for supported chart types and exam

Google 2.8k Dec 31, 2022
:bar_chart: [wip] Create beautiful, responsive, animated charts using a simple and intuitive API.

fcharts A work-in-progress chart library for Flutter. Until version 1.0.0 the API is subject to change drastically. Needless to say, fcharts is not pr

Keenan Thompson 323 Dec 21, 2022