A package for creating simple yet modern looking charts.
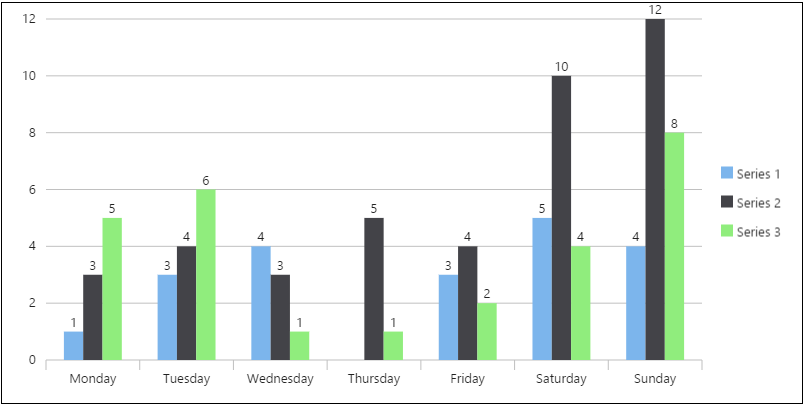
Five chart types
-
Bar
-
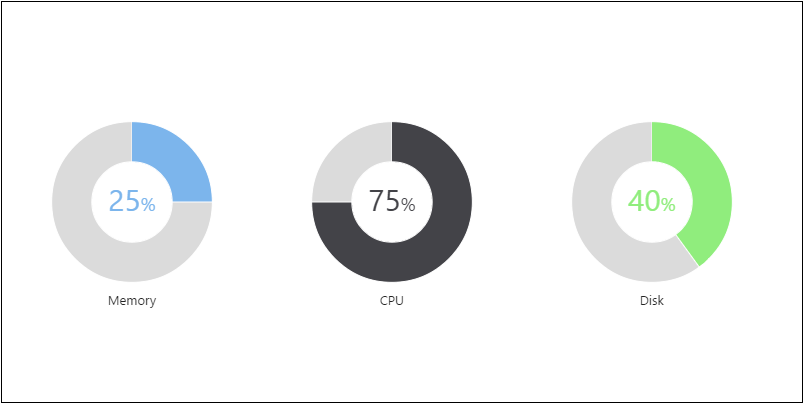
Gauge
-
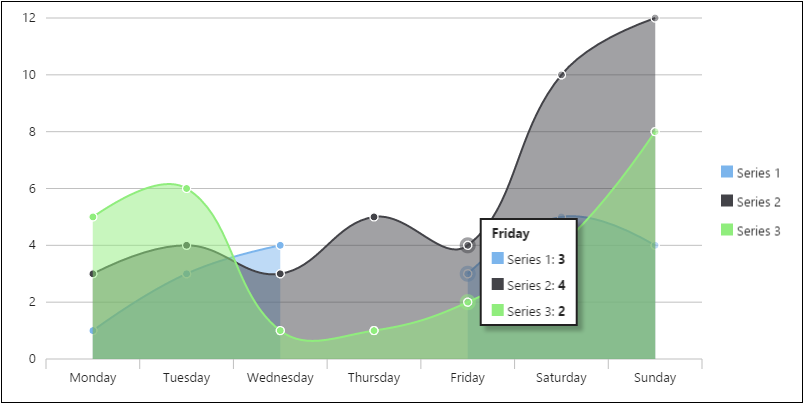
Line
-
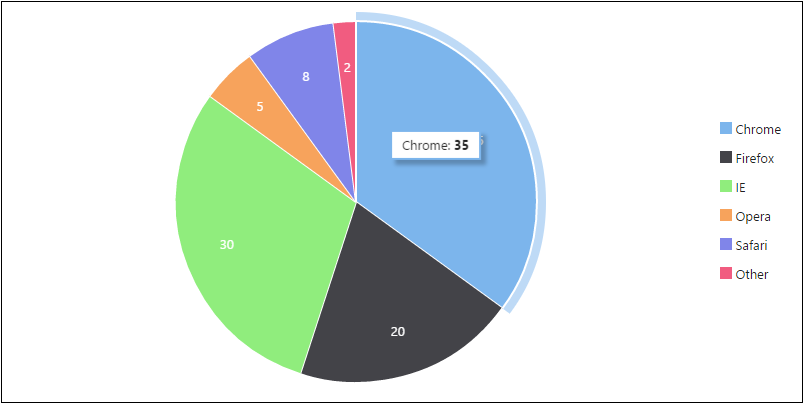
Pie
-
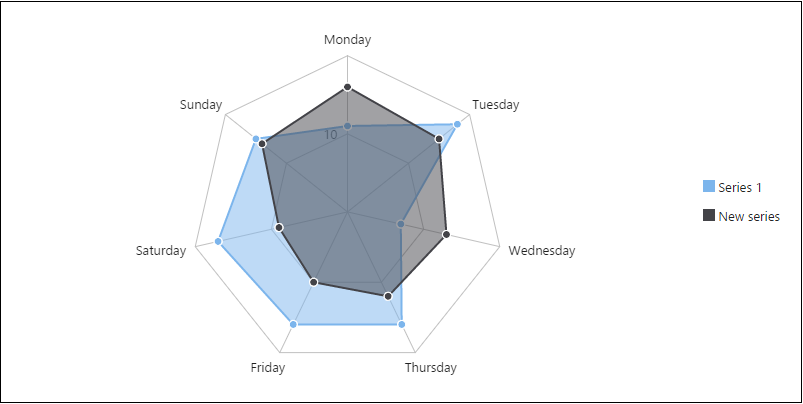
Radar
Canvas + DOM
modern_charts combines Canvas and DOM to achieve the best performance and experience.
- Canvas is used to render chart contents (axes, grids, and series)
- DOM is used to create legends and tooltips
DataTable
Data are passed to a chart via a DataTable object. By using DataTable, you can flexibly modify the data even after the chart has been rendered.
Animations
Animations are supported for different types of data modifications:
- New data table
- Changes to data table values
- Insertion and removal of rows (categories)
- Insertion and removal of columns (series)
- Series visibility toggle
Responsive
Charts automatically resize when the browser is resized.
Interactive
- Shows tooltips on hover/tap
- The visibility of a series is toggled when you click the corresponding legend item
Modular
Each chart type has its own class, so your final production code only contains the code of the chart types you use.
Usage
Please read the wiki for instructions on how to use these beautiful charts.


 28 Nov 9, 2022
 323 Dec 21, 2022
 225 Dec 25, 2022
 387 Dec 26, 2022
 402 Dec 21, 2022
 6 Jun 24, 2022
 259 Dec 30, 2022
 25 Jan 1, 2023
 2.8k Dec 31, 2022
 49 Oct 21, 2022
 36k Dec 28, 2022
 10 Oct 25, 2022
 47 Sep 27, 2022
 13 Jun 15, 2021
 19 Oct 11, 2022
 2 Jun 2, 2022
 20 Jan 2, 2023
 14 Oct 17, 2022